
Japanese candlesticks are one of the most widely used tools for analyzing price movements in stocks, cryptocurrencies, and other financial markets. While candlestick charts may look complicated at first, learning to read them is easier than you might think.
Their origins date back to 18th-century Japan and are often attributed to Munehisa Homma, a rice trader born in 1724 who studied price fluctuations. Although there is no documented exact date for their invention, his methods helped lay the groundwork for modern candlestick analysis.
The name Japanese candlesticks comes from both their origins and their appearance: a rectangular body with thin lines extending from it, resembling a candle and its wick.
What Are Japanese Candlesticks?
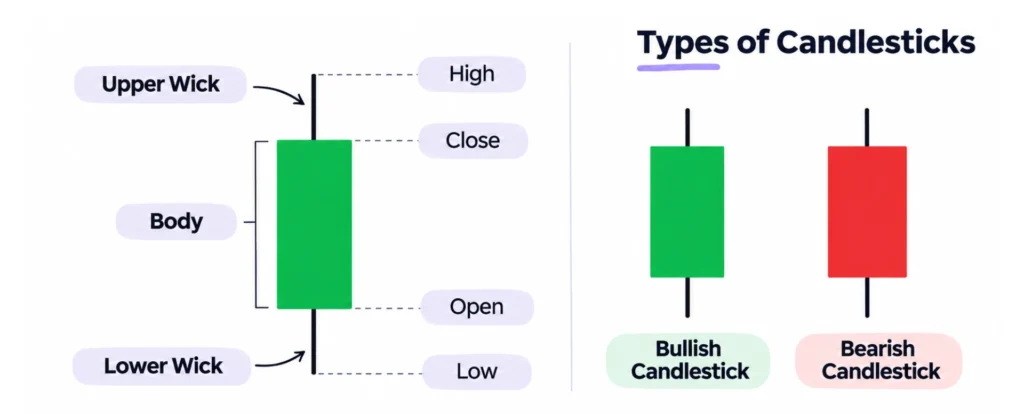
Japanese candlesticks show how an asset’s price changes over a specific period. Each candlestick provides four key pieces of information:
- Open: the price at the beginning of the period.
- Close: the price at the end of the period.
- High: the highest price reached.
- Low: the lowest price recorded.
A single candlestick can represent one minute, one hour, one day, or even an entire week, depending on the chart’s timeframe.
For example, if a stock opens at $100, reaches $110, and closes at $105, a candlestick makes these price movements easy to visualize.
How to Read Candlestick Charts
To read a candlestick, you need to understand three basic elements: the body, the wicks, and the color.
The Candlestick Body
The body is the rectangular section that represents the difference between the opening and closing prices.
A long body indicates a significant price change, while a short body means the opening and closing prices were relatively close.
Wicks or Shadows
Wicks, also called shadows, are the thin lines extending above and below the body.
The upper wick shows how high the price climbed, while the lower wick indicates how far it fell.
A long upper wick may suggest that the price attempted to rise but pulled back before closing. A long lower wick can indicate that the price dropped before recovering.
Bullish and Bearish Candlesticks
Candlesticks are typically displayed in two colors:
- Green (bullish): the closing price is higher than the opening price.
- Red (bearish): the closing price is lower than the opening price.
A green candlestick doesn’t necessarily mean the market is in an overall uptrend. To identify a trend, you need to examine multiple candlesticks together.
Types of Japanese Candlesticks
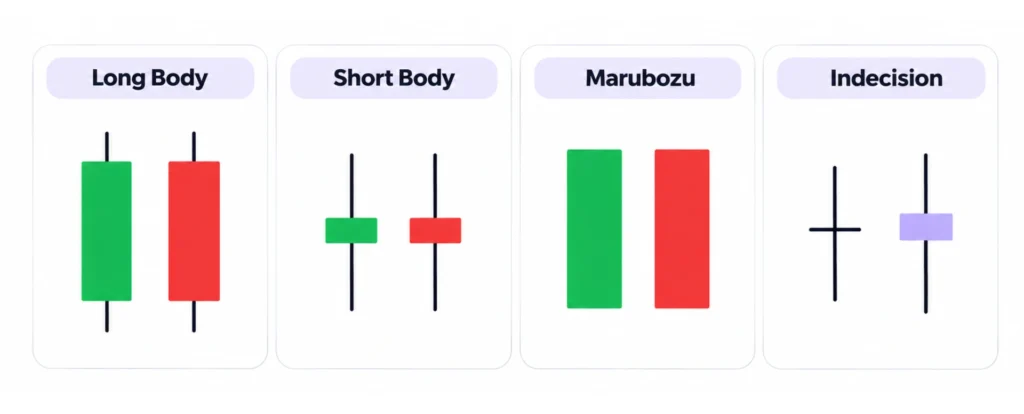
Candlesticks can be classified into several types based on their shape:
- Long body: shows a significant difference between the opening and closing prices.
- Short body: indicates that the opening and closing prices were relatively close.
- Marubozu: a candlestick with little to no wicks, indicating sustained price movement in one direction during the period.
- Indecision candles: have small bodies and may feature long wicks, showing that prices moved but ultimately closed near their opening levels.
Context matters. A small-bodied candlestick might reflect limited price movement or a highly volatile session that ended with little net change.
Common Candlestick Patterns
Candlestick patterns are formations made up of one or more candlesticks that traders use to identify potential trend reversals or continuations.
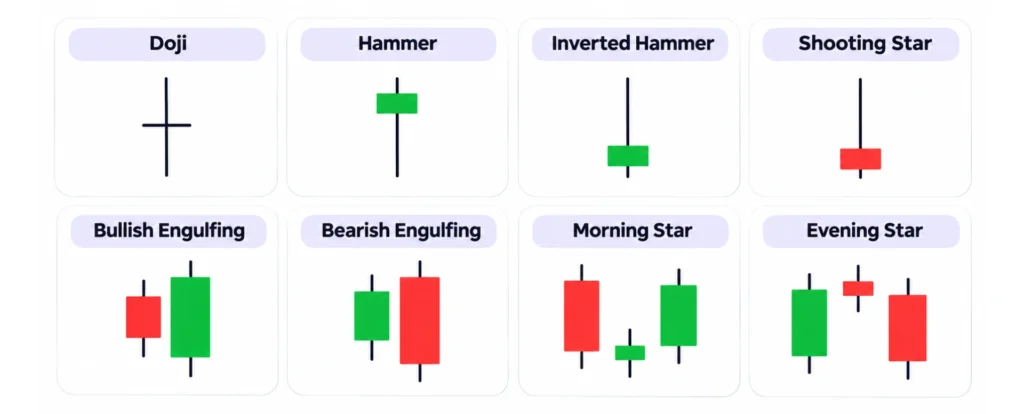
Doji
A doji forms when the opening and closing prices are nearly identical, creating a very small body. It generally reflects indecision between buyers and sellers. After an extended trend, it may suggest that momentum is weakening.
Hammer
A hammer has a small body and a long lower wick, typically at least twice the length of the body. When it appears after a decline, it may signal renewed buying pressure and a potential bullish reversal.
Inverted Hammer
An inverted hammer features a small body and a long upper wick. When it appears after a downtrend, it may indicate that buyers have attempted to push prices higher, although further confirmation is needed.
Shooting Star
A shooting star looks similar to an inverted hammer but appears after an upward price movement. Its long upper wick shows that the price reached higher levels before pulling back, potentially signaling that bullish momentum is fading.
Bullish and Bearish Engulfing Patterns
Engulfing patterns consist of two candlesticks, with the second candle’s body completely engulfing the first.
A bullish engulfing pattern typically appears after a decline, when a large green candle engulfs the body of the previous red candle.
A bearish engulfing pattern occurs after an upward move, when a large red candle engulfs the body of the previous green candle.
Both patterns may indicate a shift in the balance between buyers and sellers.
Morning Star and Evening Star
These are three-candlestick patterns.
A morning star appears after a decline. It consists of a long red candle, a small-bodied candle, and a third green candle that recovers much of the earlier loss. It may signal a bullish reversal.
An evening star follows the opposite sequence after an upward move and may indicate a potential bearish reversal.
How to Interpret Candlestick Patterns in Trading
Understanding candlestick patterns requires looking at the bigger picture. Start by identifying the market trend: uptrend, downtrend, or sideways movement. Then, examine support and resistance levels, where prices have previously struggled to move lower or higher.
Trading volume is another important factor. A price movement accompanied by high volume may carry more weight than one with relatively little trading activity.
Finally, look for confirmation. For example, a hammer that appears after a decline becomes more meaningful if the following candles show a price recovery. Still, no candlestick pattern can guarantee future price movements.
Common Mistakes When Reading Candlestick Patterns
Some of the most common mistakes include:
- Analyzing candles in isolation: the same formation can have different meanings depending on the trend.
- Treating patterns as predictions: no formation guarantees that prices will rise or fall.
- Ignoring the timeframe: a pattern on a five-minute chart isn’t equivalent to one on a daily chart.
- Reading candles before they close: their shape can change until the period ends.
- Relying solely on candlesticks: economic news, earnings reports, and other factors also influence prices.
Practical Example: How to Read a Candlestick Chart
Now that we’ve covered the main candlestick types and patterns, let’s put that knowledge into practice with a simulated stock chart.
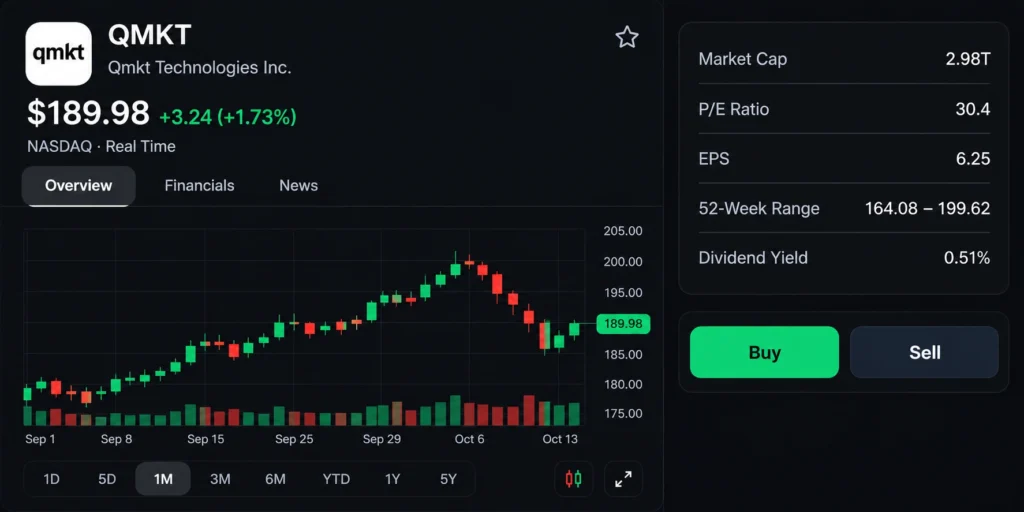
In this example, we’re looking at a stock’s price movement over approximately one month. The chart shows a final price of $189.98, up 1.73% from the previous close.
1. Identify the Trend
During the first few weeks, green candles dominate as the stock climbs from approximately $178 to $200. This indicates an uptrend, generally characterized by higher highs and higher lows.
However, after reaching $200, several consecutive red candles appear. The price begins falling toward $185, indicating a bearish correction.
2. Analyze the Patterns and Wicks
Near $200, we see small-bodied candles followed by several red candles. This sequence suggests weakening buying momentum and increasing selling pressure.
Later, around $185, a red candle with a lower wick appears. This shows that the price dropped during the session but partially recovered before closing.
The following green candles indicate an attempted recovery, although they don’t yet confirm a new uptrend.
3. Identify Support, Resistance, and Volume
The chart highlights two important price areas:
- Support around $185: buyers step in following the decline.
- Resistance around $200: the stock reaches this level before pulling back.
We can also examine the volume bars below the chart. Some of the declining sessions show relatively high trading volume, indicating increased activity during the correction.
4. What Can We Conclude?
The chart shows an initial uptrend, followed by a correction and an attempted recovery.
If the stock breaks above its recent highs, it could strengthen the case for a recovery. On the other hand, a drop below $185 might suggest that the downward movement will continue.
The main takeaway is that no candlestick should be interpreted on its own. Reading a chart means considering the candle’s color, body, wicks, patterns, trading volume, and overall trend together.
Note: This chart is a fictional simulation for educational purposes. It does not represent verified market prices or constitute investment advice.